11.6 Using the Source Editor when Debugging
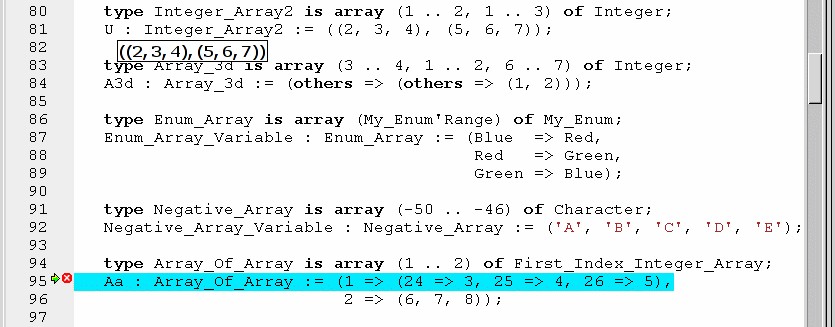
When debugging, the left area of each source editor provides the
following information:
- Lines with code
- In this area, blue dots are present next to lines for which the debugger
has debug information, in other words, lines that have been compiled with
debug information and for which the compiler has generated some code.
Currently, there is no check when you try to set a breakpoint on a non dotted
line: this will simply send the breakpoint command to the underlying
debugger, and usually (e.g in the case of gdb) result in setting a
breakpoint at the closest location that matches the file and line that you
specified.
- Current line executed
- This is a green arrow showing the line about to be executed.
- Lines with breakpoints
- For lines where breakpoints have been set, a red mark is displayed on top
of the blue dot for the line. You can add and delete
breakpoints by clicking on this area (the first click will set a breakpoint,
the second click will remove it).

The second area in the source window is a text window on the right that
displays the source files, with syntax highlighting.
If you leave the cursor over a variable, a tooltip will
appear showing the value of this variable. Automatic tooltips can be
disabled in the preferences menu.
See preferences dialog.
When the debugger is active, the contextual menu of the source window
contains a sub menu called Debug providing the following entries.
Note that these entries are dynamic: they will apply to the entity
found under the cursor when the menu is displayed (depending on the current
language). In addition, if a selection has been made in the source window the
text of the selection will be used instead. This allows you to display
more complex expressions easily (for example by adding some comments to your
code with the complex expressions you want to be able to display in the
debugger).
- Print selection
- Prints the selection (or by default the name under the cursor) in the
debugger console.
- Display selection
- Displays the selection (or by default the name under the cursor) in the
data window. The value will be automatically refreshed each time the process
state changes (e.g after a step or a next command). To freeze the display
in the canvas, you can either click on the corresponding icon in the data
window, or use the contextual menu for the specific item (see
The Data Window for more information).
- Print selection.all
- Dereferences the selection (or by default the name under the cursor) and
prints the value in the debugger console.
- Display selection.all
- Dereferences the selection (or by default the name under the cursor) and
displays the value in the data window.
- View memory at address of selection
- Brings up the memory view dialog and explores memory at the address of the
selection.
- Set Breakpoint on Line xx
- Sets a breakpoint on the line under the cursor, in the current file.
- Set Breakpoint on selection
- Sets a breakpoint at the beginning of the subprogram named selection
- Continue Until Line xx
- Continues execution (the program must have been started previously) until
it reaches the specified line.
- Show Current Location
- Jumps to the current line of execution. This is particularly useful after
navigating through your source code.
