11.3 The Data Window
11.3.1 Description
The Data Window is the area in which various information about the debugged
process can be displayed. This includes the value of selected variables, the
current contents of the registeres, the local variables, ...
This window is not open by default when you start the debugger. It will be
created automatically when needed (e.g. when using the Debug constextual menu
to display a variable). You can also force its display through the menu
Debug->Data->Data Window.
However, if you save the desktop through the menu
File->Save More->Desktop while the data window is open, it will be
automatically reopen the next time the desktop is loaded, for instance when
restarting GPS.
The contents of the data window is preserved by default whenever you close it.
Thus, if you reopen the data window either during the same debugger session,
or automatically when you start a debugger on the same executable, it will
display the same items again. This behavior is controlled by the
Preserve State on Exit preference.
The data window contains all the graphic boxes that can be accessed
using the Data->Display menu items, or the data window
Display Expression... contextual menu, or the source window
Display contextual menu items, or finally the
graph command in the debugger console.
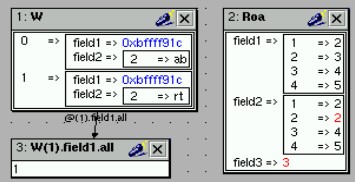
For each of these commands, a box is displayed in the data window
with the following information:

- A title bar containing:
- The number of this expression: this is a positive number starting
from 1 and incremented for each new box displayed. It represents the
internal identifier of the box.
- The name of the expression: this is the expression or variable
specified when creating the box.
- An icon representing either a flash light, or a lock.
This is a click-able icon that will change the state of the box from
automatically updated (the flash light icon) to frozen (the lock
icon).
When frozen, the value is grayed, and will not change until you change
the state. When updated, the value of the box will be recomputed each
time an execution command is sent to the debugger (e.g step, next).
- An icon representing an 'X'.
You can click on this icon to close/delete any box.
- A main area.
The main area will display the data value hierarchically
in a language-sensitive manner. The canvas knows about data structures
of various languages (e.g
C, Ada, C++) and will
organize them accordingly.
For example, each field of a record/struct/class, or each item of an
array will be displayed separately. For each subcomponent, a thin box
is displayed to distinguish it from the other components.
A contextual menu, that takes into account the current component selected
by the mouse, gives access to the following capabilities:
- Close component
- Closes the selected item.
- Hide all component
- Hides all subcomponents of the selected item. To select a particular field
or item in a record/array, move your mouse over the name of this
component, not over the box containing the values for this item.
- Show all component
- Shows all subcomponents of the selected item.
- Clone component
- Clones the selected component into a new, independent item.
- View memory at address of component
- Brings up the memory view dialog and explore memory at the address of the
component.
- Set value of component
- Sets the value of a selected component. This will open an entry box
where you can enter the new value of a variable/component. Note that
GDB does not perform any type or range checking on the value entered.
- Update Value
- Refreshes the value displayed in the selected item.
- Show Value
- Shows only the value of the item.
- Show Type
- Shows only the type of each field for the item.
- Show Value+Type
- Shows both the value and the type of the item.
- Auto refresh
- Enables or disables the automatic refreshing of the item upon program execution
(e.g step, next).
A contextual menu can be accessed in the canvas itself (point the mouse to
an empty area in the canvas, and click on the right mouse button) with the
following entries:
- Display Expression...
- Open a small dialog letting you specify an arbitrary expression
in the Data Window. This expression can be a variable name, or a
more complex expression, following the syntax of the current language and
underlying debugger.
See the documentation of e.g gdb for more details on the syntax.
The check button Expression is a subprogram call should be enabled
if the expression is actually not an expression but rather a debugger
command (e.g
p/x var) or a procedure call in the program being
debugged (e.g call my_proc).
- Align On Grid
- Enables or disables alignment of items on the grid.
- Detect Aliases
- Enables or disables the automatic detection of shared data structures.
Each time you display an item or dereference a pointer, all
the items already displayed on the canvas are considered and their addresses
are compared with the address of the new item to display. If they match,
(for example if you tried to dereference a pointer to an object already
displayed) instead of creating a new item a link will be displayed.
- Zoom in
- Redisplays the items in the data window with a bigger font
- Zoom out
- Displays the items in the data window with smaller fonts and pixmaps. This
can be used when you have several items in the window and you can't see all
of them at the same time (for instance if you are displaying a tree and
want to clearly see its structure).
- Zoom
- Allows you to choose the zoom level directly from a menu.
- Clear
- When this item is selected, all the boxes currently displayed are removed.
11.3.2 Manipulating items
11.3.2.1 Moving items
All the items on the canvas have some common behavior and can be fully
manipulated with the mouse.
They can be moved freely anywhere on the canvas, simply by clicking on
them and then dragging the mouse. Note that if you are trying to move
an item outside of the visible area of the data window, the latter will
be scrolled so as to make the new position visible.
Automatic scrolling is also provided if you move the mouse while dragging
an item near the borders of the data window. As long as the mouse
remains close to the border and the button is pressed on the item,
the data window is scrolled and the item is moved. This provides an
easy way to move an item a long distance from its initial position.
11.3.2.2 Colors
Most of the items are displayed using several colors, each
conveying a special meaning. Here is the meaning assigned to all colors
(note that the exact color can be changed through the preferences
dialog; these are the default colors):
- black
- This is the default color used to print the value of variables or
expressions.
- blue
- This color is used for C pointers (or Ada access values), i.e. all the variables
and fields that are memory addresses that denote some other value in
memory.
You can easily dereference these (that is to say see the value pointed to)
by double-clicking on the blue text itself.
- red
- This color is used for variables and fields whose value has changed since
the data window was last displayed. For instance, if you display an array
in the data window and then select the Next button in the tool bar, then
the elements of the array whose value has just changed will appear in red.
As another example, if you choose to display the value of local variables in
the data window (Display->Display Local Variables), then only the
variables whose value has changed are highlighted, the others are left in
black.
11.3.2.3 Icons
Several different icons can be used in the display of items. They also
convey special meanings.
- trash bin icon
- This icon indicates that the debugger could not get the value of the
variable or expression. There might be several reasons, for instance the
variable is currently not in scope (and thus does not exist), or it might
have been optimized away by the compiler. In all cases, the display will be
updated as soon as the variable becomes visible again.
- package icon
- This icon indicates that part of a complex structure is currently hidden.
Manipulating huge items in the data window (for instance if the variable
is an array of hundreds of complex elements) might not be very helpful. As a
result, you can shrink part of the value to save some screen space and make it
easier to visualize the interesting parts of these variables.
Double-clicking on this icon will expand the hidden part, and clicking on
any sub-rectangle in the display of the variable will hide that part and
replace it with that icon.
See also the description of the contextual menu to automatically show or hide
all the contents of an item. Note also that one alternative to hiding
subcomponents is to clone them in a separate item (see the contextual menu
again).