It is sometimes convenient to look at the assembly code for the subprogram or source line you are currently debugging.
You can open the assembly window by using the menu
Debug->Data->Assembly.
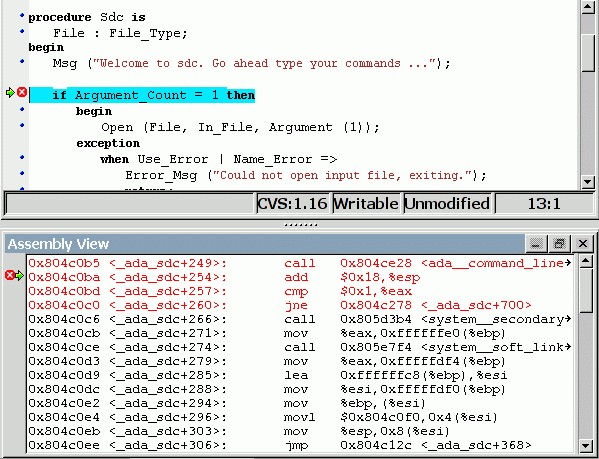
The current assembly instruction is highlighted with a green arrow on its left. The instructions corresponding to the current source line are highlighted in red by default. This allows you to easily see where the program counter will point to, once you have pressed the "Next" button on the tool bar.
Moving to the next assembly instruction is done through the "Nexti" (next instruction) button in the tool bar. If you choose "Stepi" instead (step instruction), this will also jump to the subprogram being called.
For efficiency reasons, only a small part of the assembly code around the current instruction is displayed. You can specify in the preferences dialog how many instructions are displayed by default. Also, you can easily display the instructions immediately preceding or following the currently displayed instructions by pressing one of the <Page up> or <Page down> keys, or by using the contextual menu in the assembly window.
A convenient complement when debugging at the assembly level is the
ability of displaying the contents of machine registers.
When the debugger supports it (as gdb does), you can select the
Data->Display Registers menu to get an item in the canvas that will
show the current contents of each machine register, and that will be updated
every time one of them changes.
You might also choose to look at a single register.
With gdb, select the Data->Display Any Expression, entering
something like
output /x $eax
in the field, and selecting the toggle button "Expression is a subprogram call". This will create a new canvas item that will be refreshed every time the value of the register (in this case eax) changes.