11.1 The Debug Menu
The Debug entry in the menu bar provides operations that act at a
global level. Key shortcuts are available for the most common operations, and
are displayed in the menus themselves.
Here is a detailed list of the menu items that can be found in the menu bar:
- Run...
- Opens a dialog window allowing you to specify the arguments to pass to the
program to be debugged, and whether this program should be stopped at the
beginning of the main subprogram. If you confirm by clicking on the OK
button, the program will be launched according to the arguments entered.
- Step
- Execute the program until it reaches a different source line.
- Step Instruction
- Execute the program for one machine instruction only.
- Next
- Execute the program until it reaches the next source line,
stepping over subroutine calls.
- Next Instruction
- Execute the program until it reaches the next machine instruction,
stepping over subroutine calls.
- Finish
- Continue execution until selected stack frame returns.
- Continue
- Continue execution of the program being debugged.
- Interrupt
- Asynchronously interrupt the program being debugged. Note that depending on
the state of the program, you may stop it in low-level system code that does
not have debug information, or in some cases, not even a coherent state. Use
of breakpoints is preferable to interrupting programs. Interrupting programs
is nevertheless required in some situations, for example when the
program appears to be in an infinite (or at least very time-consuming) loop.
- Terminate Current
- Terminate the current debug session
by terminating the underlying debugger (e.g
gdb) used
to handle the low level debugging. You can control what happens to the
windows through the Debugger/Debugger Windows preference.
- Terminate
- Terminate all your debug sessions. Same as
Terminate Current if there
is only one debugger open.
11.1.1 Debug
- Connect to Board...
- Opens a simple dialog to connect to a remote board. This option is only
relevant to cross debuggers.
- Load File...
-
Opens a file selection dialog that allows you to choose a program to
debug. The program to debug is either an executable for native debugging, or
a partially linked module for cross environments (e.g VxWorks).
- Add Symbols...
- Add the symbols from a given file/module. This corresponds to the gdb
command add-symbol-file. This menu is particularly useful under VxWorks
targets, where the modules can be loaded independently of the debugger.
For instance, if a module is independently loaded on the target (e.g. using
windshell), it is absolutely required to use this functionality,
otherwise the debugger won't work properly.
- Attach...
- Instead of starting a program to debug, you can instead attach to an
already running process. To do so, you need to specify the process id
of the process you want to debug. The process might be busy in an
infinite loop, or waiting for event processing. Note that as for
core files, you need to specify an executable before attaching to a
process.
- Detach
- Detaches the currently debugged process from the underlying debugger.
This means that the executable will continue to run independently. You can use
the Attach To Process menu later to re-attach to this process.
- Debug Core File...
- This will open a file selection dialog that allows you to debug a core file
instead of debugging a running process. Note that you must first specify an
executable to debug before loading a core file.
- Kill
- Kills the process being debugged.
11.1.2 Data
Note that most items in this menu need to access the underlying debugger
when the process is stopped, not when it is running. This means that you first
need to stop the process on a breakpoint or interrupt it, before using
the following commands. Failing to do so will result in blank windows.
- Data Window
- Displays the Data window. If this window already exists, it is raised so
that it becomes visible
- Call Stack
- Displays the Call Stack window.
See The Call Stack Window for more details.
- Threads
- Opens a new window containing the list of threads currently present in
the executable as reported by the underlying debugger. For each thread,
it will give information such as internal identifier, name and status.
This information is language- and debugger-dependent. You should refer to
the underlying debugger's documentation for more details.
As indicated above, the process being debugged needs to be stopped
before using this command, otherwise a blank list will be displayed.
When supported by the underlying debugger, clicking on a thread will
change the context (variables, call stack, source file) displayed,
allowing you to inspect the stack of the selected thread.
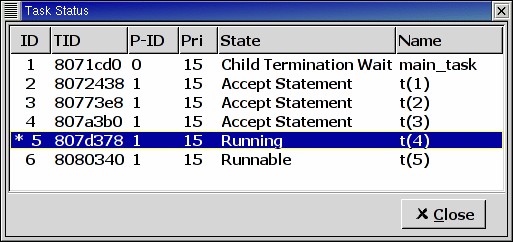
- Tasks
- For GDB only, this will open a new window containing the list of Ada
tasks currently present in the executable. Similarly to the thread
window, you can switch to a selected task context by clicking on it, if
supported by GDB. See the GDB documentation for the list of
items displayed for each task.
As for the thread window, the process being debugged needs to be stopped
before using this window.
- Protection Domains
- For VxWorks AE only, this will open a new window containing the
list of available protection domains in the target. To change to a
different protection domain, simply click on it. A
indicates the current protection domain.
- Assembly
- Opens a new window displaying an assembly dump of the current code
being executed.
See The Assembly Window for more details.
- Edit Breakpoints
- Opens an advanced window to create and modify any kind of breakpoint,
including watchpoints (see The Breakpoint Editor).
For simple breakpoint creation, see the description of the source window.
- Examine Memory
- Opens a memory viewer/editor. See The Memory Window for more
details.
- Command History
- Opens a dialog with the list of commands executed in the current session.
You can select any number of items in this list and replay the selection
automatically.
- Display Local Variables
- Opens an item in the Data Window containing all the local variables
for the current frame.
- Display Arguments
- Opens an item in the Data Window containing the arguments
for the current frame.
- Display Registers
- Opens an item in the Data Window containing the machine registers
for the current frame.
- Display Any Expression...
- Opens a small dialog letting you specify an arbitrary expression
in the Data Window. This expression can be a variable name, or a
more complex expression, following the syntax of the underlying debugger.
See the documentation of e.g gdb for more details on the syntax.
The check button Expression is a subprogram call should be enabled
if the expression is actually a debugger
command (e.g
p/x var) or a procedure call in the program being
debugged (e.g call my_proc).
- Recompute
- Recomputes and refreshes all the items displayed in the Data Window.